Know Your Local Content Baseline Score at Any Point in the Year
Designed for Saudi-based organizations with LCGPA reporting obligations, Penny’s Local Content Tracker automatically calculates and tracks your score across all four pillars — so you can act before it’s too late
Most organizations rely on spreadsheets and disconnected data to calculate and report their baseline Local Content score, often only during year-end audits. This reactive approach limits visibility, delays corrective action, and increases risk. Penny’s Local Content Tracker replaces conventional processes with real-time tracking, automated scoring, and continuous insight. The result? Reduced risk, lower cost overhead, and no last-minute surprises.
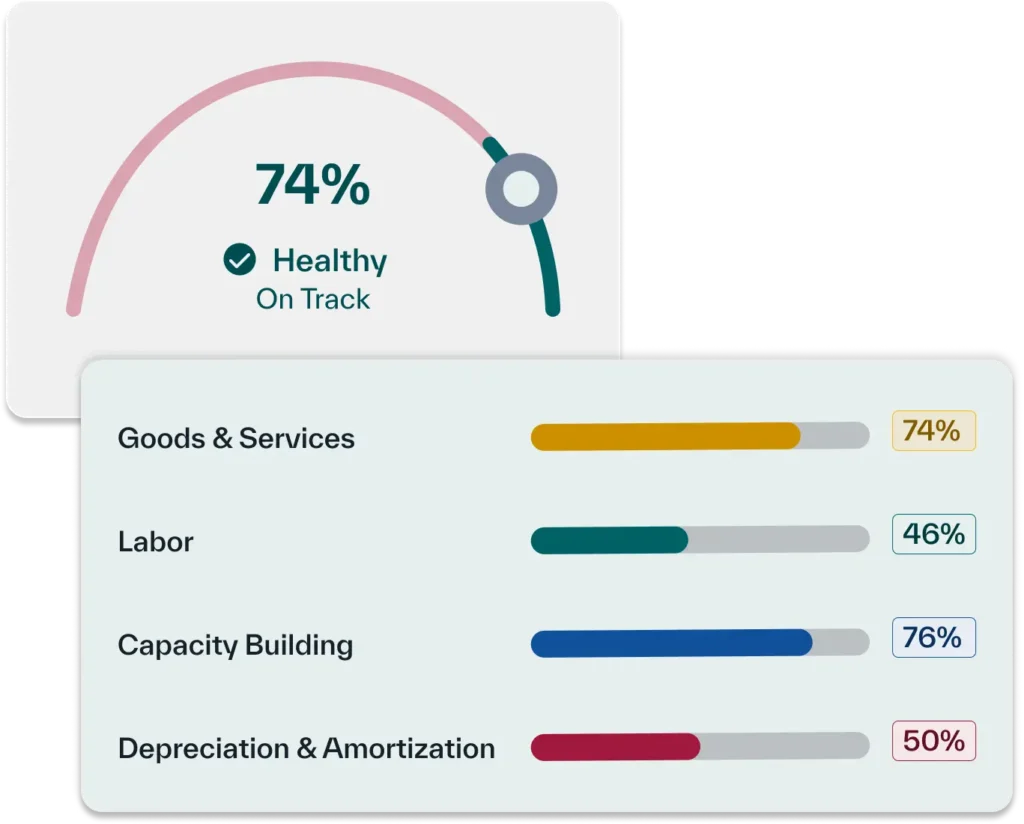
Reflecting performance across procured Goods & Services, spend on labor & capacity building, and expenses related to depreciation and amortization, all in one live dashboard.
Dedicated dashboards help you identify opportunities to localize spend across each of the four Local Content pillars: goods & services, labor, capacity building, and assets.
Easily filter, customize, and export reports in CSV format to simplify LCGPA audits and internal reviews without manual formatting, chasing data, or back-and-forth between teams.
Eliminate silos across departments by compiling data via bulk uploads or automated ERP connections, enabling cross-departmental access, and ensuring data consistency.
Track your Local Content score live all year round, not just at year-end audits.
Streamlined Control
A centralized source of truth to manage your Local Content performance.
Cost Efficiency
Eliminate manual work to reduce overhead and save valuable time and resources.
Risk Mitigation
Identify areas of underperformance early and take timely corrective action.
Digital Consolidation
Unified view across all four local content scopes: Goods & Services, Labor, Capacity Building, and Depreciation.
Organized Documentation
Maintain structured records to support smoother audit processes.
Frequently Asked Questions
What is the Local Content Baseline Score?
The Local Content Baseline Score measures an organization's contribution to the Saudi economy across four pillars: goods & services, labor, capacity building, and depreciation & amortization. It is calculated in line with the requirements of the Local Content and Government Procurement Authority (LCGPA) and is typically verified through an audit process.
How does Penny's Local Content Tracker calculate my score?
Penny automatically classifies your transactions, maps them to the four Local Content pillars, and calculates your score overall and per pillar. Instead of waiting for a year-end audit, you can view your performance at any point in the year through a live dashboard.
Can the Local Content Tracker integrate with our ERP system?
Yes. Penny connects with major ERP and procurement platforms for real-time data sync, and also supports bulk data uploads using customized templates, so your Local Content data stays consolidated in one connected view.
How does the tracker help us prepare for an LCGPA audit?
Penny keeps your records structured and audit-ready throughout the year. You can filter, customize, and export reports in CSV format, with traceability from summary insights down to source transactions, reducing the manual effort of preparing audit templates and evidence.
Cookies
This site uses cookies to offer you a better browsing experience. Find out more on how we use cookies and how you can change your settings.