For organizations in Saudi Arabia, local content has become a measure of how much they contribute to the national economy. It is easy to think of it as a single score on a report. In practice, that score reflects choices made across the business every day, from which suppliers win a contract to how teams invest in people and capability. For a wider view of the topic, see how Saudi companies prove local content compliance.
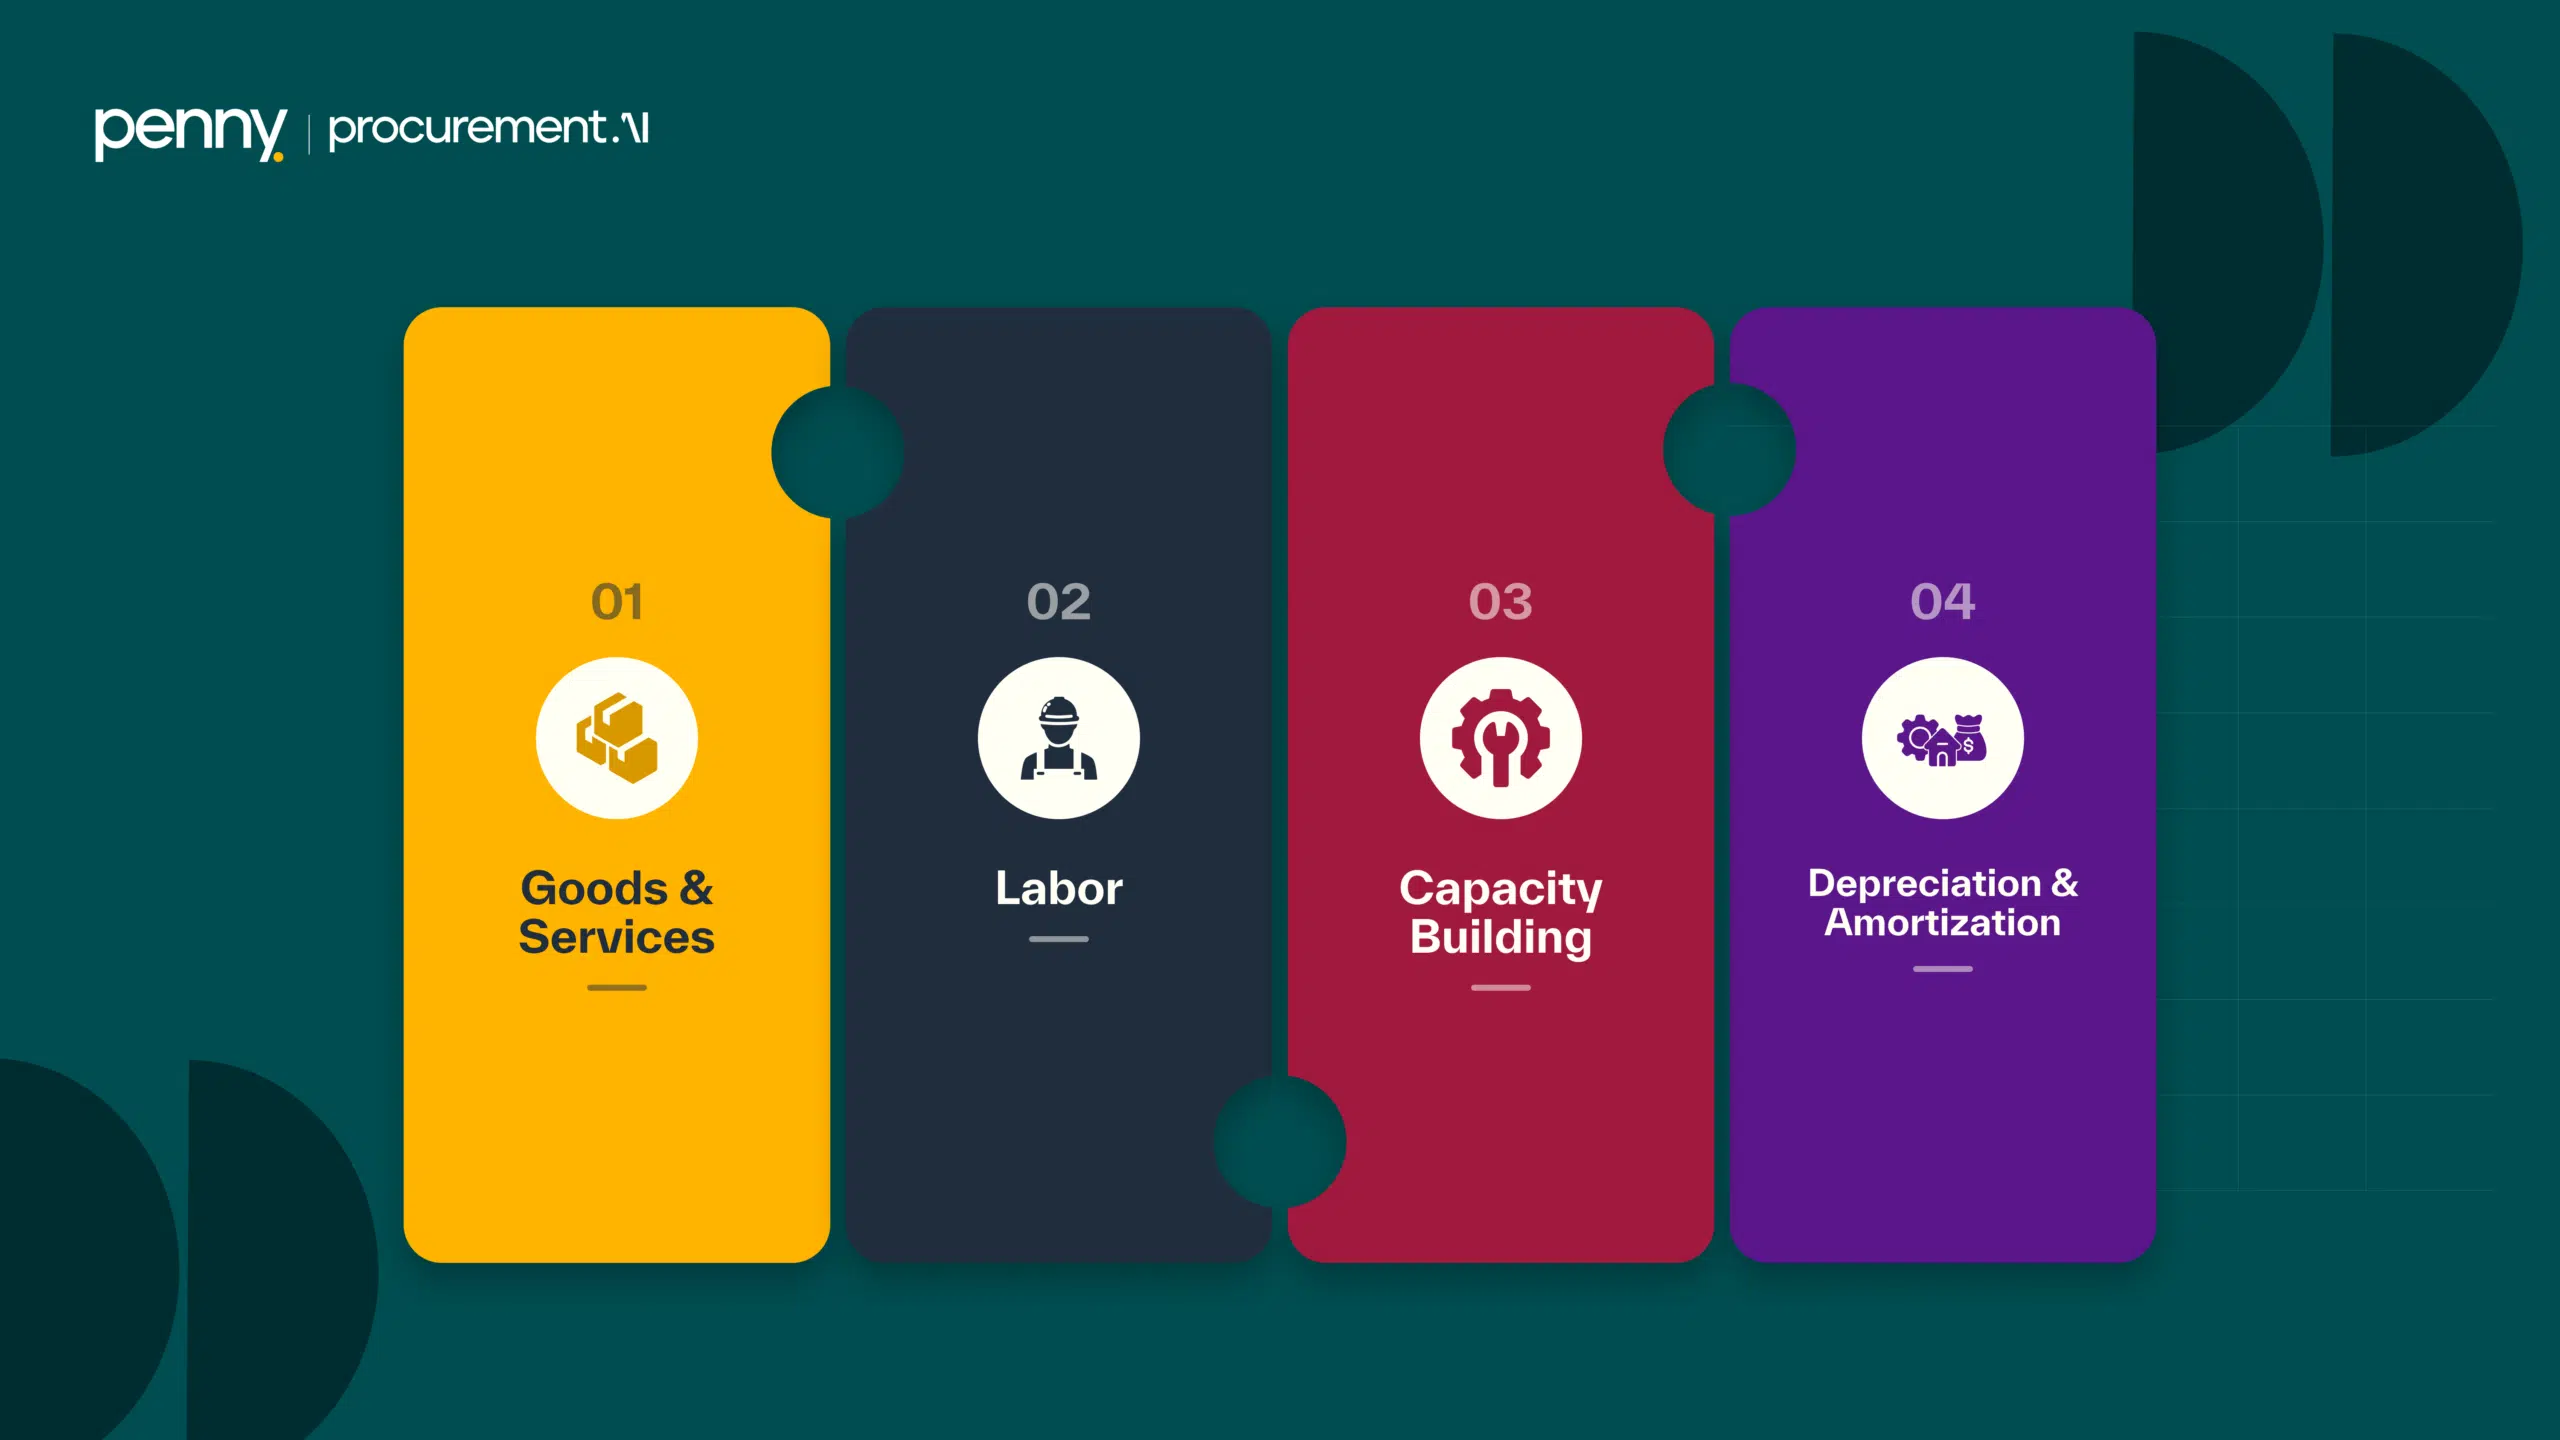
The score rests on four pillars: Goods and Services, Labor, Depreciation and Amortization, and Capacity Building. Each pillar captures a different kind of contribution to the Saudi economy. Together they produce what is known as the Local Content Baseline Score. Understanding what each pillar covers is the first step to measuring local content accurately and improving it before results are affected.
Why the Four Pillars Matter
Each pillar draws on a different part of the organization. Procurement holds supplier and spend data. Human resources holds workforce data. Finance holds asset records. Training and development teams hold capability data. When these sources sit in separate departments, the score is hard to assemble and harder to trust.
Knowing which pillar each contribution belongs to helps teams see where they stand. It also shows where a weak pillar is pulling the overall score down, so the organization can act while there is still time to change the result.
Pillar 1: Goods and Services
The Goods and Services pillar covers local procurement, supplier spend, and sourcing contribution. It looks at where the organization buys and how much of that spend supports the local economy.
Every purchase decision touches this pillar. Choosing a supplier, awarding a contract, or raising a purchase order all shape the result. That makes procurement data central to the score, and it makes accurate supplier classification essential from the start.
Pillar 2: Labor
The Labor pillar covers workforce-related inputs and employment contribution. It reflects how the organization contributes to the local economy through the people it employs.
Strong performance here depends on reliable workforce data. When those records stay accurate and current, the organization can report this pillar with confidence.
Pillar 3: Depreciation and Amortization
The Depreciation and Amortization pillar includes asset-related contribution in the local content calculation. It recognizes that investment in assets forms part of an organization’s economic footprint, alongside its spending and its workforce.
Asset data typically sits with finance teams. Bringing it into the calculation makes sure that long-term asset investment counts toward the score.
Pillar 4: Capacity Building
The Capacity Building pillar captures training, development, and local capability initiatives. It reflects how the organization develops skills and capability, rather than only buying from or hiring within the existing market.
Contributions here can be easy to overlook, because they are spread across training programs and development initiatives. Capturing them consistently ensures this effort is reflected in the overall score.
How the Pillars Work Together
No single pillar tells the whole story. An organization might perform well on Goods and Services while a weak Capacity Building pillar holds the overall score back. Viewing the score both overall and by pillar shows exactly where the gaps are. It also helps teams focus their effort where it will make the biggest difference.
How Penny AI Tracks the Four Pillars
Local Content is one of the core modules in the Penny AI system. The Penny AI Local Content Tracker is built for Saudi-based organizations with local content reporting obligations. It calculates and monitors the Local Content Baseline Score across all four pillars, so teams can act before problems affect their results.
Data reaches the Tracker in two ways. Teams can add it through bulk uploads using customized templates, or connect their ERP for real-time sync. Penny AI integrates with major ERP and procurement systems, including SAP Ariba, Oracle, Microsoft Dynamics 365, and Odoo. This consolidation removes silos across departments.
Once the data arrives, transactions are automatically classified, mapped to the right pillar, and scored, both overall and by pillar. Live dashboards give a real-time, consolidated view of the score. Spend insights break down local versus foreign spend across each pillar, with reports by workspace and expense account. Vendor tables show each supplier’s category and contribution.
Audit readiness is built in. Teams can generate structured, audit-friendly reports and export them as CSV. Every figure stays traceable, from summary insights down to the source transactions behind them.
Frequently Asked Questions
What are the four pillars of local content?
The four pillars are Goods and Services, Labor, Depreciation and Amortization, and Capacity Building. Together they measure an organization’s contribution to the Saudi economy.
What does the Goods and Services pillar cover?
It covers local procurement, supplier spend, and sourcing contribution. In short, it reflects where the organization buys and how that spending supports the local economy.
What is the Local Content Baseline Score?
It is the score that measures an organization’s contribution to the Saudi economy. It draws on all four pillars, and organizations can view it both overall and pillar by pillar.
How does Penny AI collect local content data?
Teams can add data through bulk uploads with customized templates, or through ERP integration for real-time sync. Penny AI connects with systems including SAP Ariba, Oracle, Microsoft Dynamics 365, and Odoo.
Can local content reports be traced back to the source data?
Yes. Penny AI provides traceability from summary insights down to source transactions, and teams can export structured, audit-friendly reports as CSV.
Conclusion
Local content is easy to treat as a figure produced once for a report. The four pillars show why it deserves more attention than that. Goods and Services, Labor, Depreciation and Amortization, and Capacity Building each reflect real decisions made across the organization, every day. When teams understand what each pillar covers and track all four together, they can spot weak areas early and act before the result is set. That turns local content from a reporting task into something the organization can actively manage and improve.
Want a real-time view of your local content performance across all four pillars? See how the Penny AI Local Content Tracker brings your data together in one place.